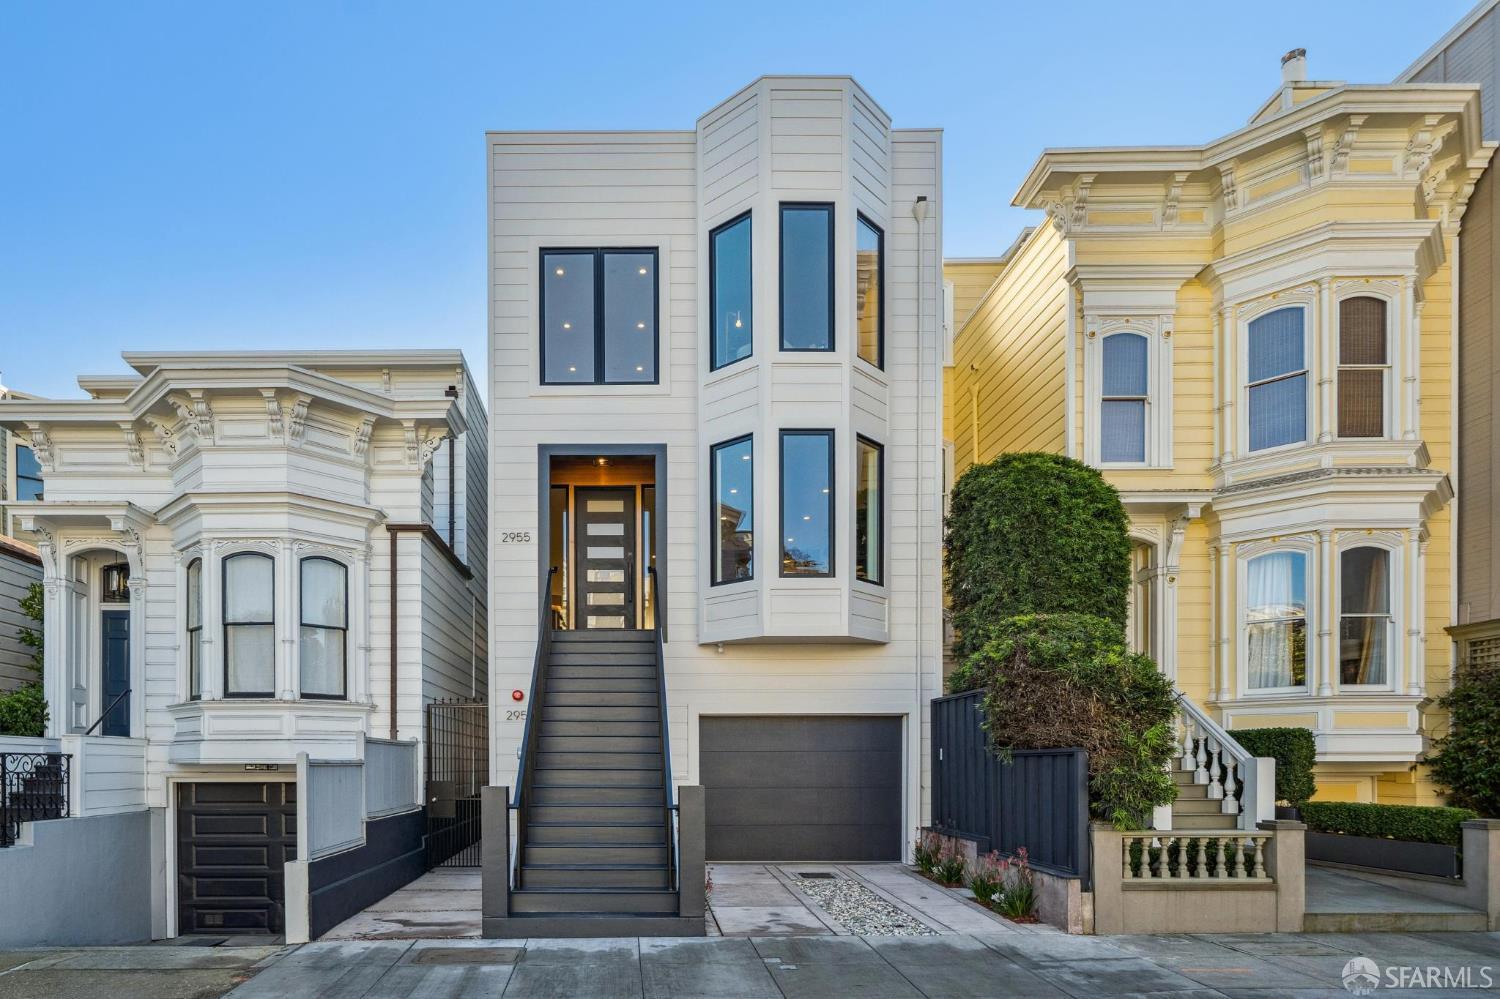
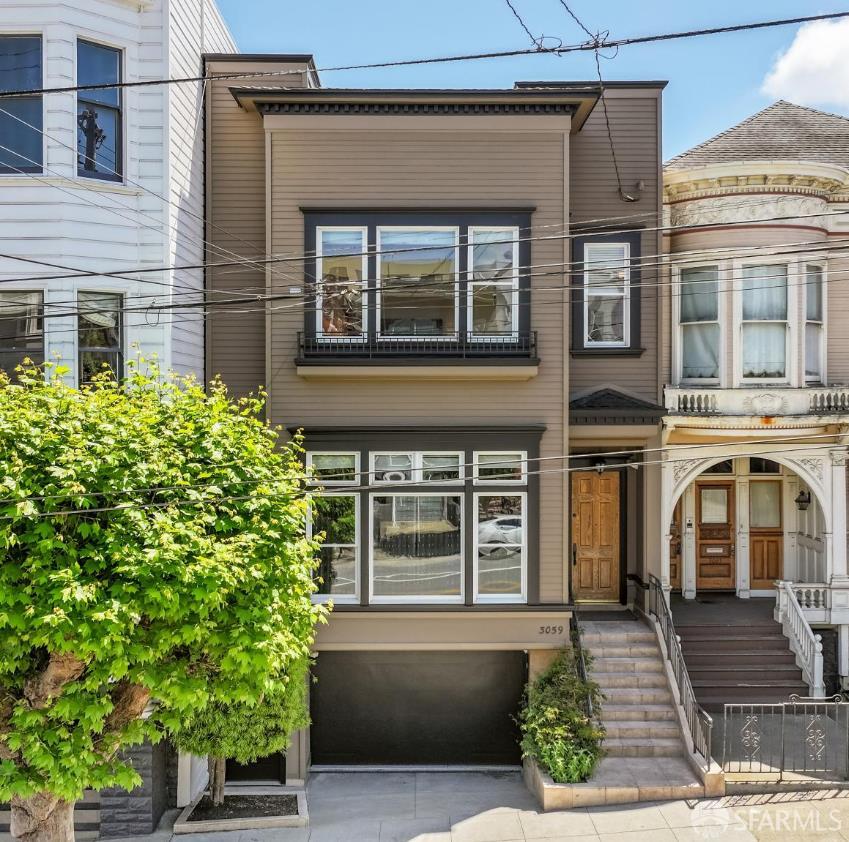
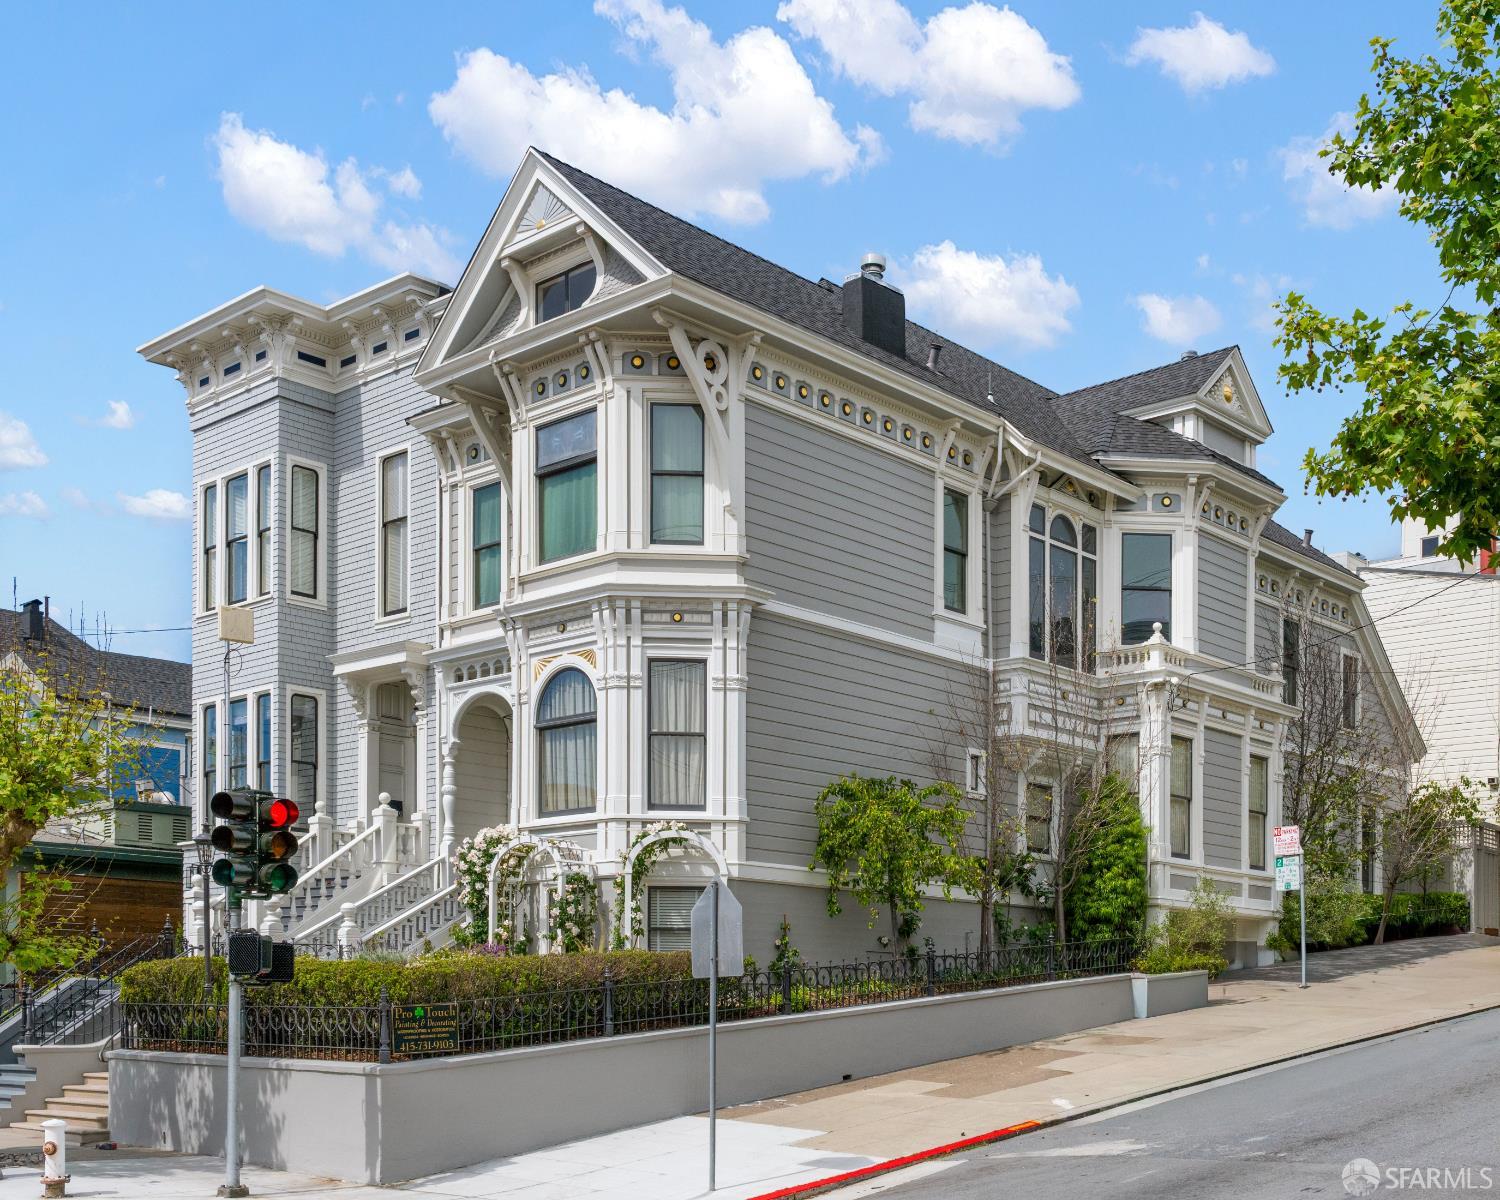
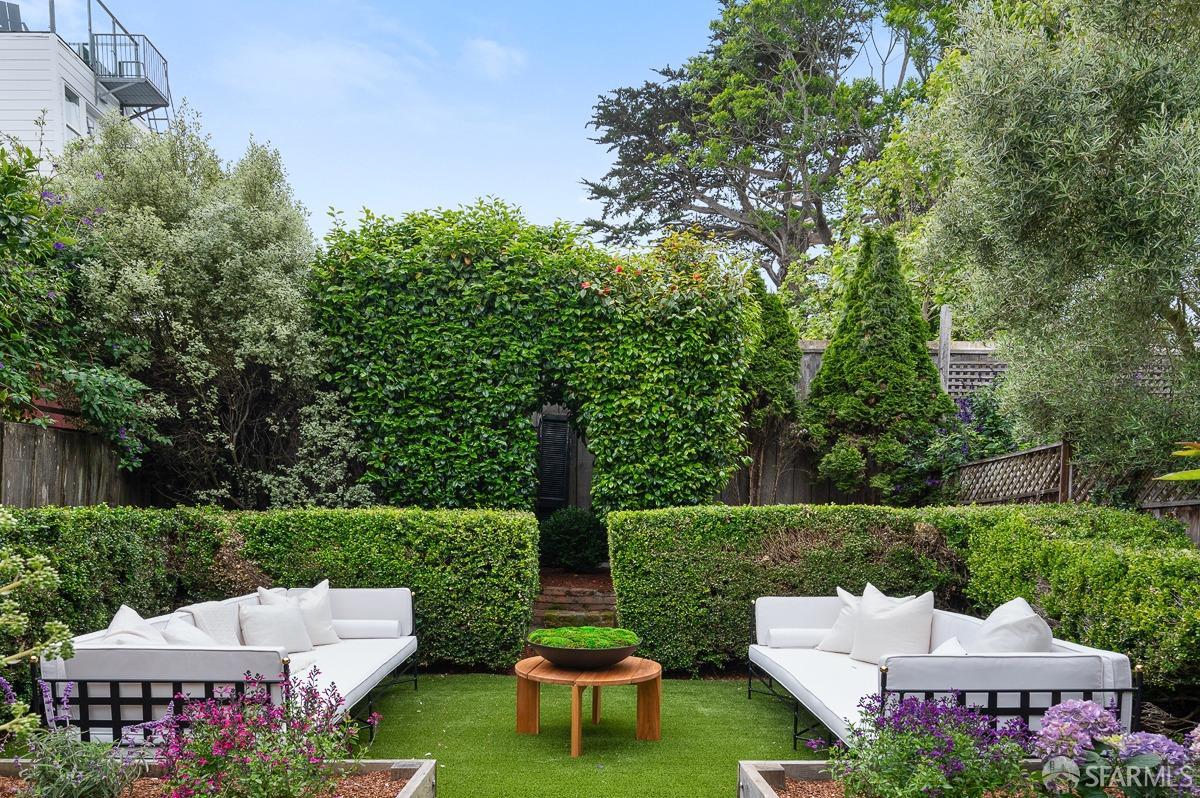
Featured Properties
Browse the available properties in the area below.
12,932 people live in Lower Pacific Heights, where the median age is 41 and the average individual income is $103,996. Data provided by the U.S. Census Bureau.
Total Population
Median Age
Population Density Population Density This is the number of people per square mile in a neighborhood.
Average individual Income
Lower Pacific Heights has 6,919 households, with an average household size of 2. Data provided by the U.S. Census Bureau. Here’s what the people living in Lower Pacific Heights do for work — and how long it takes them to get there. Data provided by the U.S. Census Bureau. 12,932 people call Lower Pacific Heights home. The population density is 43,986 and the largest age group is Data provided by the U.S. Census Bureau.
Total Population
Population Density Population Density This is the number of people per square mile in a neighborhood.
Median Age
Men vs Women
Population by Age Group
0-9 Years
10-17 Years
18-24 Years
25-64 Years
65-74 Years
75+ Years
Education Level
Total Households
Average Household Size
Average individual Income
Households with Children
With Children:
Without Children:
Marital Status
Blue vs White Collar Workers
Blue Collar:
White Collar:
We pride ourselves on providing personalized solutions that bring our clients closer to their dream properties and enhance their long-term wealth.
Contact Us